
In most things in life and business, there is an “evaluate” stage when you try to make progress toward a goal. Look familiar?

No matter the company, industry, situation or topic, this is the fundamental approach to achieving success. Your online branding and marketing activities are no different. To go a little deeper, we’ve outlined four simple steps to ensure your online presence is as strong as it can be and continues to progress: Set goals, prioritize them, run analytics, and then evaluate success and modify accordingly.
1. Set Goals
The first step in measuring whether your digital strategy is delivering the results you want is to figure out what success looks like.
The default list above is an ideal list of goals for a typical business-to-business (B2B) scenario, but for some organizations—B2C, nonprofit, etc.—you’ll need to modify the goals accordingly. Be sure to revise the verbiage so that it makes sense to you and your team, and add other specific goals that pertain to you and your situation.
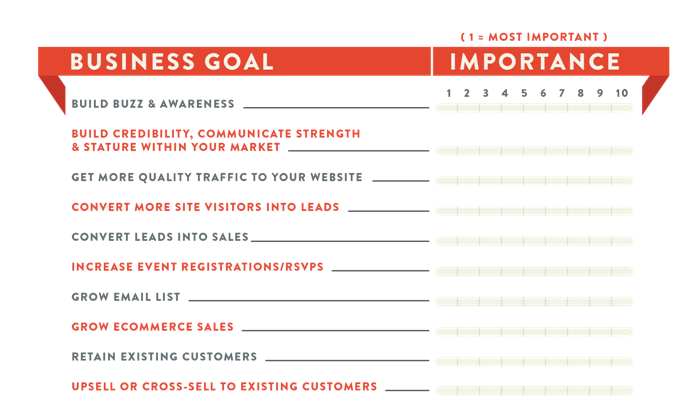
2. Prioritize Your Goals
Now that you have a working list, it’s imperative to prioritize your goals from 1 to 10, 1 meaning most important and 10 being the least important. The challenge lies in finishing the exercise with only one No. 1, one No. 2, and so on.
When have you ever heard of three gold medalists in a single race? The top three finishers were all really, really fast, but I guarantee there was only one No. 1. Treat your goals the same way. This will help you make decisions on where to invest your time, spend your money and evaluate results in the correct perspective.
3. Track Success Through Analytics
Now that you have your priorities, you can determine the key metrics that will tell you whether or not you are achieving your goals. Here are a few examples of key online metrics to track relating to the goals above.
Build awareness and buzz
Website visits // This is the combined sum of organic search traffic, direct traffic and referring site traffic (i.e. all non-advertising traffic). Called “hits” back in the day, now referred to as “sessions” by Google Analytics, make sure this number grows month after month. Track this for a year to begin noticing seasonal or cyclical trends you can start preparing for.
Social media engagement // Track metrics like Facebook Shares, Post Clicks, Likes and Twitter Favorites and Retweets. Go through and count them manually, use built-in analytics or take advantage of a tool like SproutSocial to get these numbers instantly. Either way, this is a great measurement that your brand messaging is resonating with your target audience.
Visits from search engines // Are users finding you organically on Google, Yahoo or Bing? Great! You must be doing something right.
Build credibility, and communicate strength and stature within your market
Backlinks and root-linking domains // How many sites are linking to yours? These links say, hey, your site has great content that is really valuable. Moz provides a free tool to track your backlinks and backlink services to your site: moz.com/researchtools/ose.
External referring traffic // Is your online activity sending traffic to your website? Analyze the total visits to your site from other sites; social networks like Facebook, Twitter and LinkedIn; and your email campaigns.
Number of blog subscribers // Are you putting out relevant and engaging content? Well, if this number continues to grow each month, then that just might be the case!
Get more quality traffic to your website
Bounce rate // This is the percentage of visits where a visitor left your site from an entrance page without going any deeper into the site. An oversimplified rule of thumb is to get this number under 60 percent. However, like most things in life … it depends. This number depends on what page users are landing on. (Is it a blog post where visitors can get their fill of information and then leave? If so, that’s understandable.)
Pages per visit // This is the average number of pages viewed per visit to your site. Depending on your site architecture and how the user landed on your site, hopefully this number is three or greater. That typically tells you users are looking to learn more about you.
Average time on site // This is your average visit duration. Analytics calculates the time of all visits and divides that sum by the total number of visits. For example, 1,000 minutes divided by 100 visits equals 10 minutes on average.
Convert more site visitors into leads
Total website conversions // If you’re using Google Analytics, it’s important to have Goals set up so that you can track the number of visitors taking key actions on your site.
Inquiry or contact form submissions
Email list sign-ups // When users opt-in to receive your email communication, they are no longer just a visitor, but now have been converted to a lead.
Gated content downloads // Another example of a conversion, this is where a user has to give some piece of contact information in order to access a specific piece of content, such as a white paper.
4. Evaluate and Move Forward
Take a look at your key metrics at least once every month. It’s imperative to stay on top of what’s going on and to make it a priority to record these numbers (preferably in a spreadsheet).
Take the time to crunch the numbers, and figure out what if you’re marketing tactics from link building services you’re using to the social media marketing tactics you’re using are working—and, conversely, what’s not working.
From this, you can prioritize a few tasks in order to improve your results and reach new heights the next month.